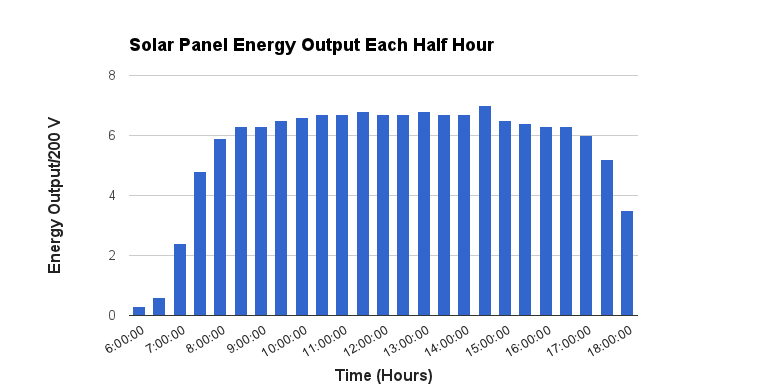
 The graph below shows the energy output in a data table. The graph also shows the weather at the time of the test. This accounts for the peaks times for harvesting the suns energy.
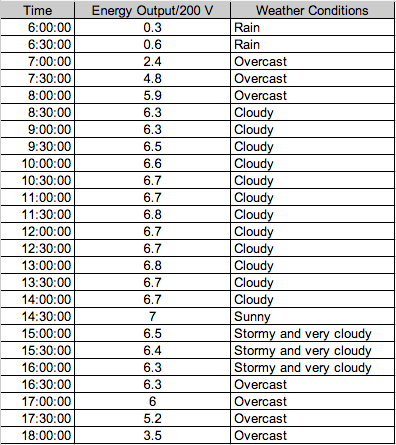 |
The graph to the left shows the amount of energy produced every half an hour. The data on the table shows that the the amount of energy increases as the day goes on and then reaches it peak at 11:00 through 3:00.     |
|